Health Monitoring
Kubevious is equipped with application health monitoring. Kubevious lets you focus on applications as a whole and then guides you towards Pods that underperform. That makes Kubevious a unique troubleshooting tool for modern Kubernetes applications.
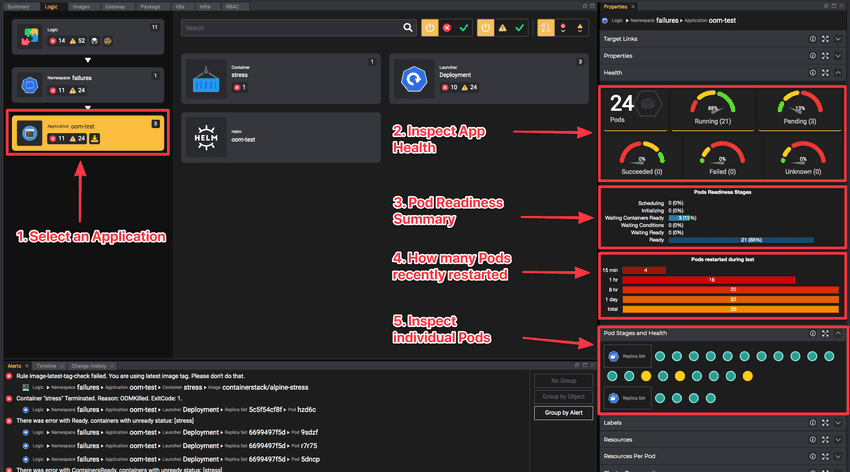
The Health properties at the Application level present the overall health summary of Pods included in the Applications, their lifecycle, and restart summaries.
The top five gauges include the total number and percentage of Running, Pending, Succeeded, Failed, and Unknown Pods. In the screenshot below, we have 21 Pods running, representing 88% of all app Pods, and 3 Pods still pending (13%).
Charts of Pod readiness lifecycle follow next. Pods first get scheduled on a node; then, all init containers are completed successfully; then containers and custom conditions (if any) are marked as ready; and finally, the Pod is marked as ready and ready to serve requests. In the screenshot below, you can see that 3 Pods (13%) are still waiting for containers to get ready, but 88% of all Pods are fully ready.

Health properties also track Pod restarts at the Application level. The bar chart shows how many of the application Pods restarted throughout the lifetime, during the last 15 minutes, 1 hour, 8 hours, and one day. Note that this chart would not track the number of restarts but pods that get restarted. For example, if there are 20 pods total, and one of them gets into a crash loop, only a single pod would be counted in the Pods restarted chart.
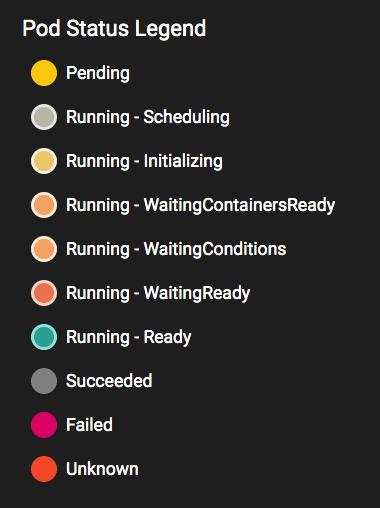
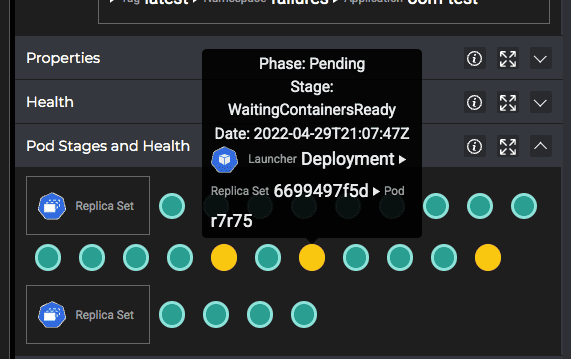
Kubevious also monitors individual Pods’ lifecycles and presents them in the Pod Stages and Health properties. That view helps track how Pod health changes across different versions. In the screenshot below, we can see that 3 Pods are still Pending (represented by yellow circles), there are 4 Pods still running an older version (lower row), and the rest of the pods are ready (green circles). See color codes for all pod phases and states below.

Tooltips present lifecycle details for each Pod and let you navigate directly to the Pod configuration and properties.

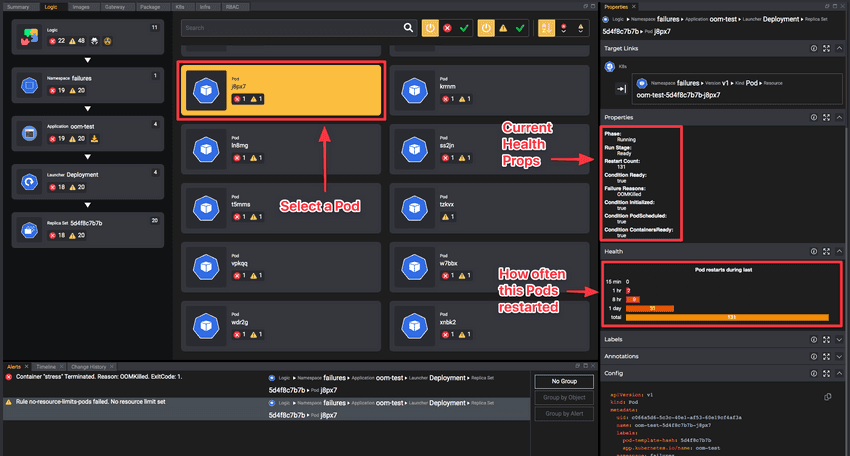
At the Pod level, we have access to the pod YAML manifest and how often the pod restarted during the last 15 minutes, 1 hour, 8 hours, or a day.
