
5 Top & Useful Kubernetes Monitoring Tools
While distributed computing and orchestration has solved various problems when it comes to running applications in containers. But there is more to containers than just running of applications. A Kubernetes cluster of nodes physically might appear as a single computer, but in reality, it is a connected set of multiple microservices and hundreds of pods that require continuous monitoring.
In this post, we have listed the five most popular open-source tools you can use for the successful monitoring of Kubernetes.
1. Kubernetes Dashboard
Kubernetes dashboard is the default web-based user interface for observing containers in Kubernetes. The Kubernetes dashboard gives a steady method to visualize the essential information of the Kubernetes clusters just as the individual containers running in pods. It is an integral part of the Kubernetes environment allowing executives to see and deal with the monitoring aspects of Kubernetes clusters.
Notable Features of Kubernetes Dashboard:
-
Deployment of applications in Pods.
-
Overview of the applications running in the pods
-
Troubleshoot the running applications in pods
-
Change the amount of resources required by the cluster
-
Modify and update the state of container resources in the cluster
-
Basic metrics measurements, for example, RAM and CPU utilization for each Kubernetes pod.
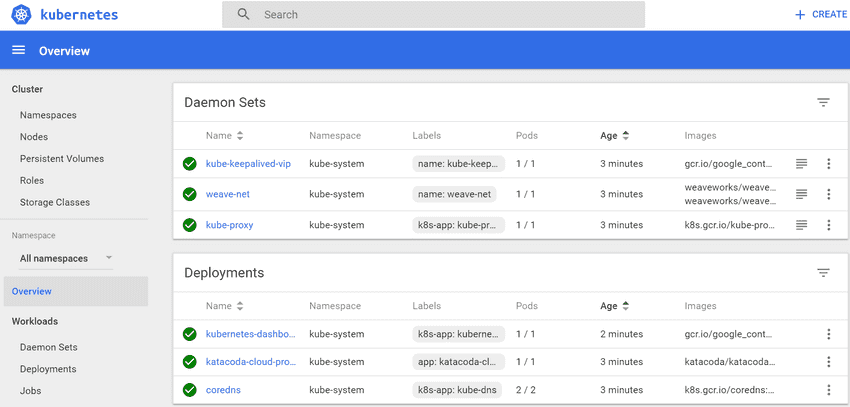
Pros: Basic overview of cluster data, actions are easy to execute from the dashboard. Big community.
Cons: Not rich visualization capabilities. Does not have advanced resource metrics.
2. Prometheus
Prometheus is a very famous open source monitoring tools among clients of Kubernetes. Began as a SoundCloud venture now a piece of CNCF (Cloud Native Computing Foundation), Prometheus has developed as a standard for monitoring Kubernetes. What makes Prometheus different is its method of retrieving resource metrics based on a time series from a given endpoint.
Prometheus is partitioned into three components a Prometheus server, Alert manager, and exporters, which perform different tasks. Exporters are independent containers that create and export out metrics by means of API. The Prometheus server deals with service distribution and extract metrics from the exporters to be put away in the database for monitoring. Alert manager is used for setting up alert rules and messages if a specific trigger is activated.
Other Features of Prometheus:
-
Multi-dimensional data model-Users can access data in time series form by their “name” and “key/value pairs.”
-
The above mentioned multi-dimensional data can be queried or analyzed using a query language called PromQL
-
No need to rely on distributed storage,
-
Prometheus collect time-series data via a pull model over HTTP.
-
Multiple modes are available for graph and dashboard support.
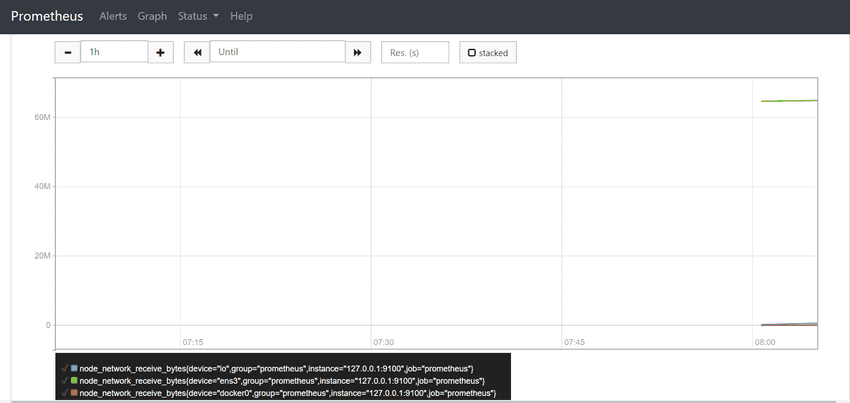
Here, querying Prometheus for node_network_receive_bytes will show how active the disk IO is.
Pros: Easy to use query-based system, built-in alert systems, huge native community, excellent at small scale Cons: Tough to scale at large networks due to storage. Though, there are projects like “Thanos” that mitigate that shortcoming.
3. The ELK Stack (a.k.a the Elastic Stack)
ELK is the most popular open-source monitoring tool when it comes to logging in Kubernetes. ELK is an acronym for Elasticsearch, Logstash, and Kibana, which are different components of ELK. Each component plays a crucial role when it comes to logging clusters in Kubernetes:
- Elasticsearch: Provides easy storing and searching of millions of documents
- Logstash: Designed to process logs before putting them on storage.
- Kibana: Analytic tool to get insights from the logs.
- MetricBeat: Helps in sending information in between components of elastic stack.
ELK stack collects information from the pods deployed on nodes, then stores the data in a central location, which is visualized and analyzed in the end via Kibana. Some organizations also use Fluentd instead of Logstash for streaming logs, which is not a part of ELK stack but used with Kubernetes quite vigorously for logs handling.
ELK stack also has an enterprise edition with an X-Pack that provides additional tools such as role-based access control (RBAC), alerting, and reporting, which are not present in non-enterprise versions of ELK stack.
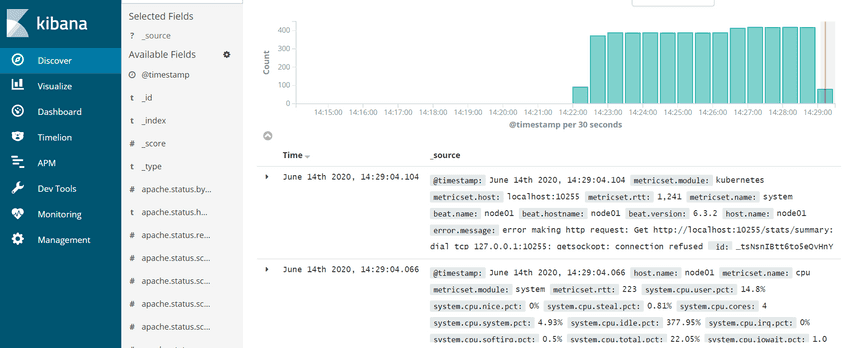
Pros: Easy to use after configuring. Rich analytic capabilities. Collect, search, analyze, and visualize in one place.
Cons: Difficult to maintain at large scale. Initial deployment and day 2 operations are complex.
4. Weavescope
Weavescope is a monitoring tool developed by Weaveworks, which provides troubleshooting and monitoring capabilities for Docker and Kubernetes. Weavescope makes topologies of infrastructure, which generates a map showing containers and processes of Kubernetes cluster and microservices for easy monitoring.
So, if you are looking for a monitoring tool that provides a visual overview of your Kubernetes clusters, Weavescope is your best bet since it shows the infrastructure and connections among the various components to search for in-depth details.
Other Notable Features of the Weavescope:
- Support for different deployment styles (Local, hosted, or hybrid).
- Real-time metrics
- Nodes are filtering by CPU and Memory usage to identify containers using the most resources quickly.
- Allows the user to manage containers and run commands within the user interface.
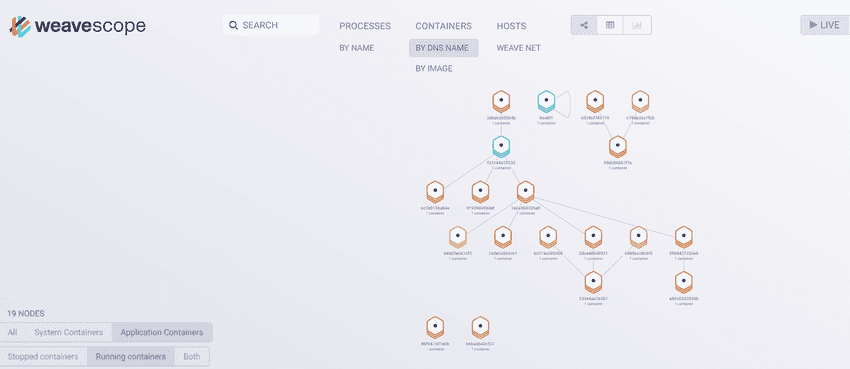
Pros: Interactive UI, zero-configuration required
Cons: Lacks advanced analytics
5. cAdvisor
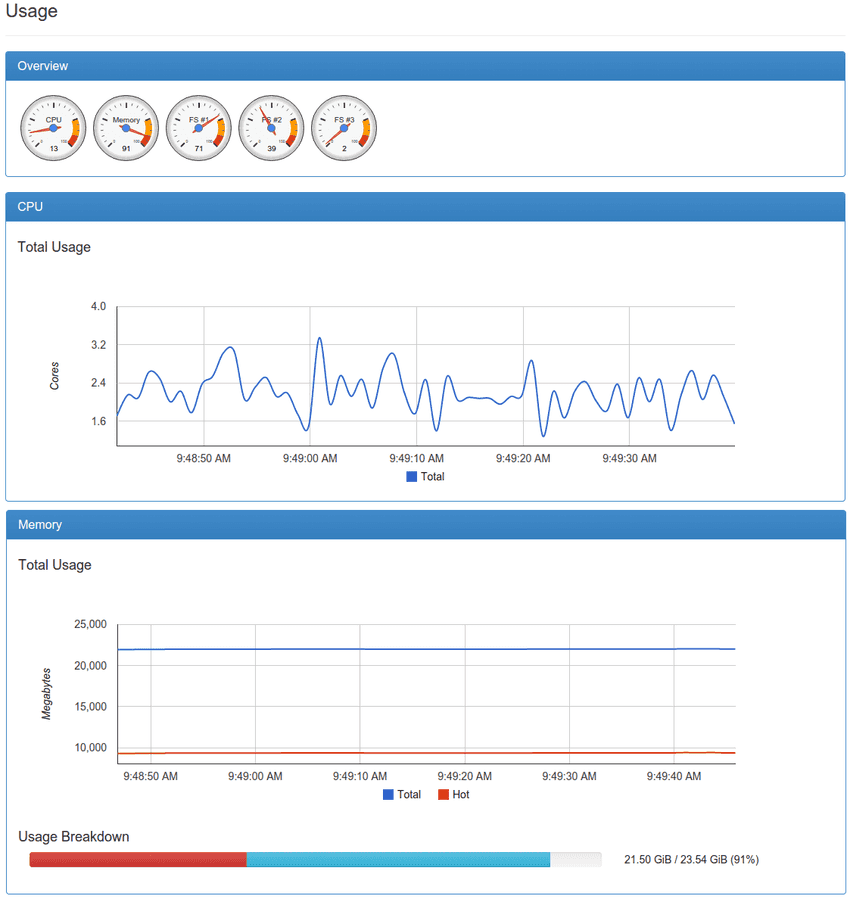
cAdvisor or content resource advisor is an open-source resource analysis tool which is inbuilt in Kubernetes. cAdvisor collects stats and resource metrics for various machines and operates at the node level. It autodetects all containers in the given node and collects CPU, memory, and network usage for those containers. Unlike most other monitoring tools, cAdvisor only provides basic resource utilization, which makes it ideal for beginners to monitor Kubernetes clusters.
Other notable features of cAdvisor:
- Native support for Docker containers and other container types.
- Provides resource usage by analyzing the containers.
- Support for running outside of the Docker
- Metrics can be viewed on the Web user interface.
Pros: Inbuilt in Kubernetes, easy to use, provides basic resource metrics
Cons: Lacks advanced monitoring.
Conclusion
The organizations widely use all the monitoring tools mentioned above for Kubernetes, and they all have their pros and cons. However, most of these solutions are easy to configure and use, but no one solution can cater to all the requirements. So, it is better to explore what aspects of analysis matter most to you. From there, you can derive a unique monitoring solution that provides actionable insights for your business.
You can also refer to part 2 of our top-5 kubernetes monitoring tools picks.